seabornって何?
Pythonでグラフといえばmatplotlibです。
matlabライクなグラフがかけるので、numpyやscipyと合わせてmatlabの代代替環境として利用している方も多いのではないでしょうか。
(matplotlibに関してはwikipediaを見てください)
matplotlib - Wikipedia
で、matplotlibをより簡単に美しくしたのがseabornです。
ほぼラッパーみたいなものなようです。
どうしてわざわざ使うのか?
別にmatplotlibで困っていない方も多いと思います。
実際私もそうでした。
それではなぜわざわざseabornを使うのか?
それは他の人より少し綺麗なグラフがかけるからです。ただそれだけ。(私的には)
綺麗というより、他の人と違うことが重要だと思っています。たいていみんなエクセルかmatlabですからね。
目立つ資料を作りたいから使うんです(笑)
それに綺麗な資料のほうがみんな見てくれる気がするし(笑)
使い方
インストールは簡単。
pip install seaborn
たぶんmatplotlibも必要です。
で、あとはseabornのサイトにあるgalleryを見てみましょう
Example gallery — seaborn 0.8.1 documentation
(ちょっとexampleに追記しています)
import matplotlib.pyplot as plt
import seaborn as sns
sns.set(style="ticks")

# Load the example dataset for Anscombe's quartet
df = sns.load_dataset("anscombe")

# Show the results of a linear regression within each dataset
sns.lmplot(x="x", y="y", col="dataset", hue="dataset", data=df,
           col_wrap=2, ci=None, palette="muted", size=4,
           scatter_kws={"s": 50, "alpha": 1})
plt.show()

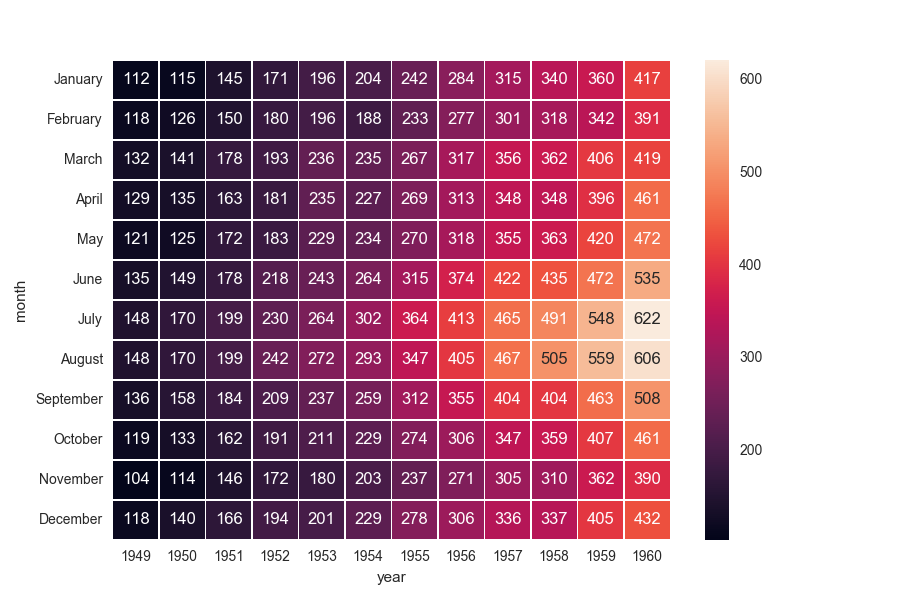
一番重宝しているヒートマップ
import matplotlib.pyplot as plt
import seaborn as sns
sns.set()

# Load the example flights dataset and conver to long-form
flights_long = sns.load_dataset("flights")
flights = flights_long.pivot("month", "year", "passengers")

# Draw a heatmap with the numeric values in each cell
f, ax = plt.subplots(figsize=(9, 6))
sns.heatmap(flights, annot=True, fmt="d", linewidths=.5, ax=ax)
plt.show()

おわり
やっぱり綺麗ですね。特にヒートマップがお気に入りです。
データに対して最適なグラフや配色を選ぶのは本当に難しいです。まだまだ自分も勉強不足で、いつも悩んでいます。
seabornはこれからも頻繁に使うので(主に仕事で)、おもしろいグラフが描けたら忘れないようにブログに書いていこう。
っていうかこれはもう仕事なのでは?
参考サイト
qiita.com
myenigma.hatenablog.com